Monitor
Every signal,
one screen.
Metrics, logs, traces, synthetic checks, golden signals, service maps, and SLO matrices unified into one live picture of system health. Replace five dashboards with one.
With Nova
One Platform
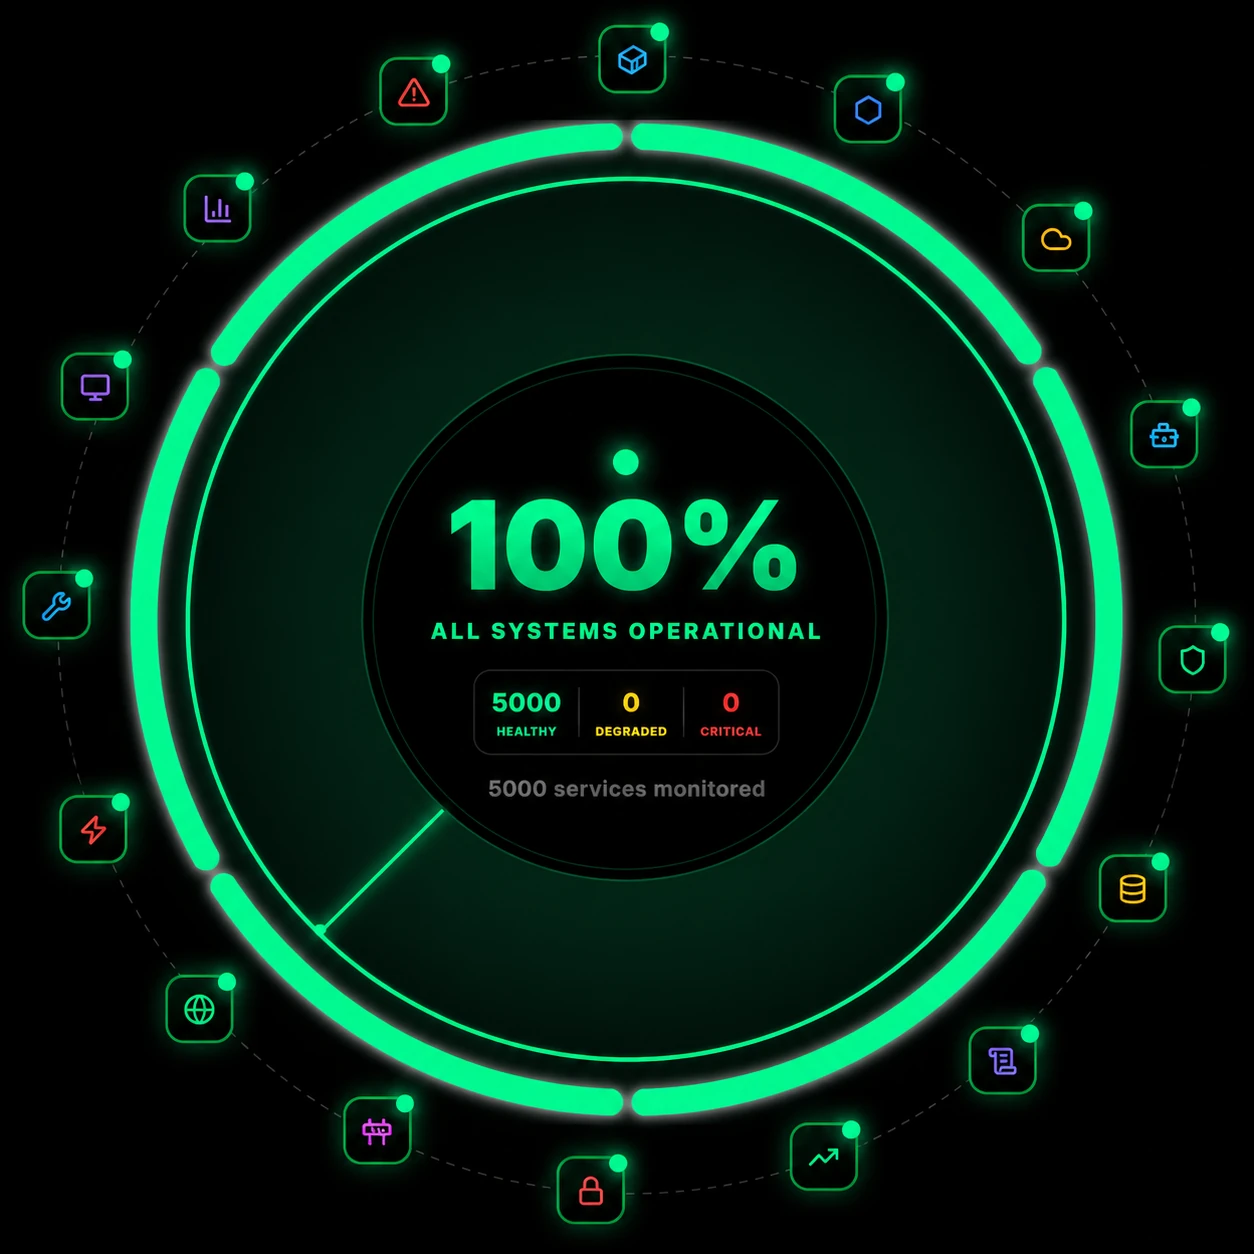
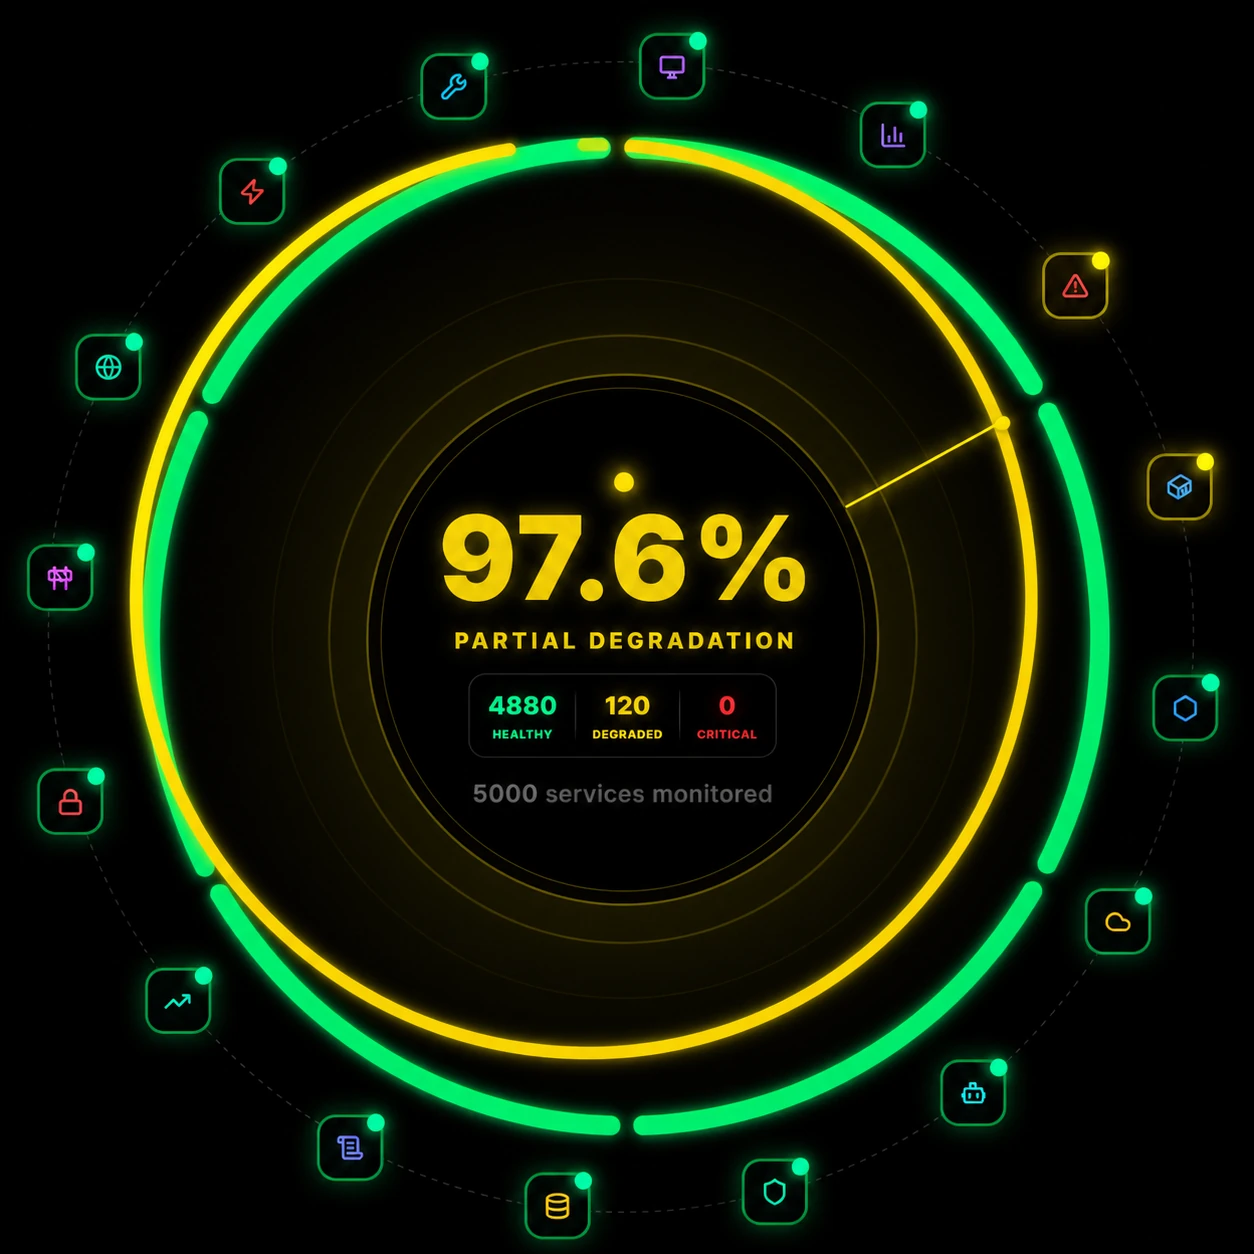
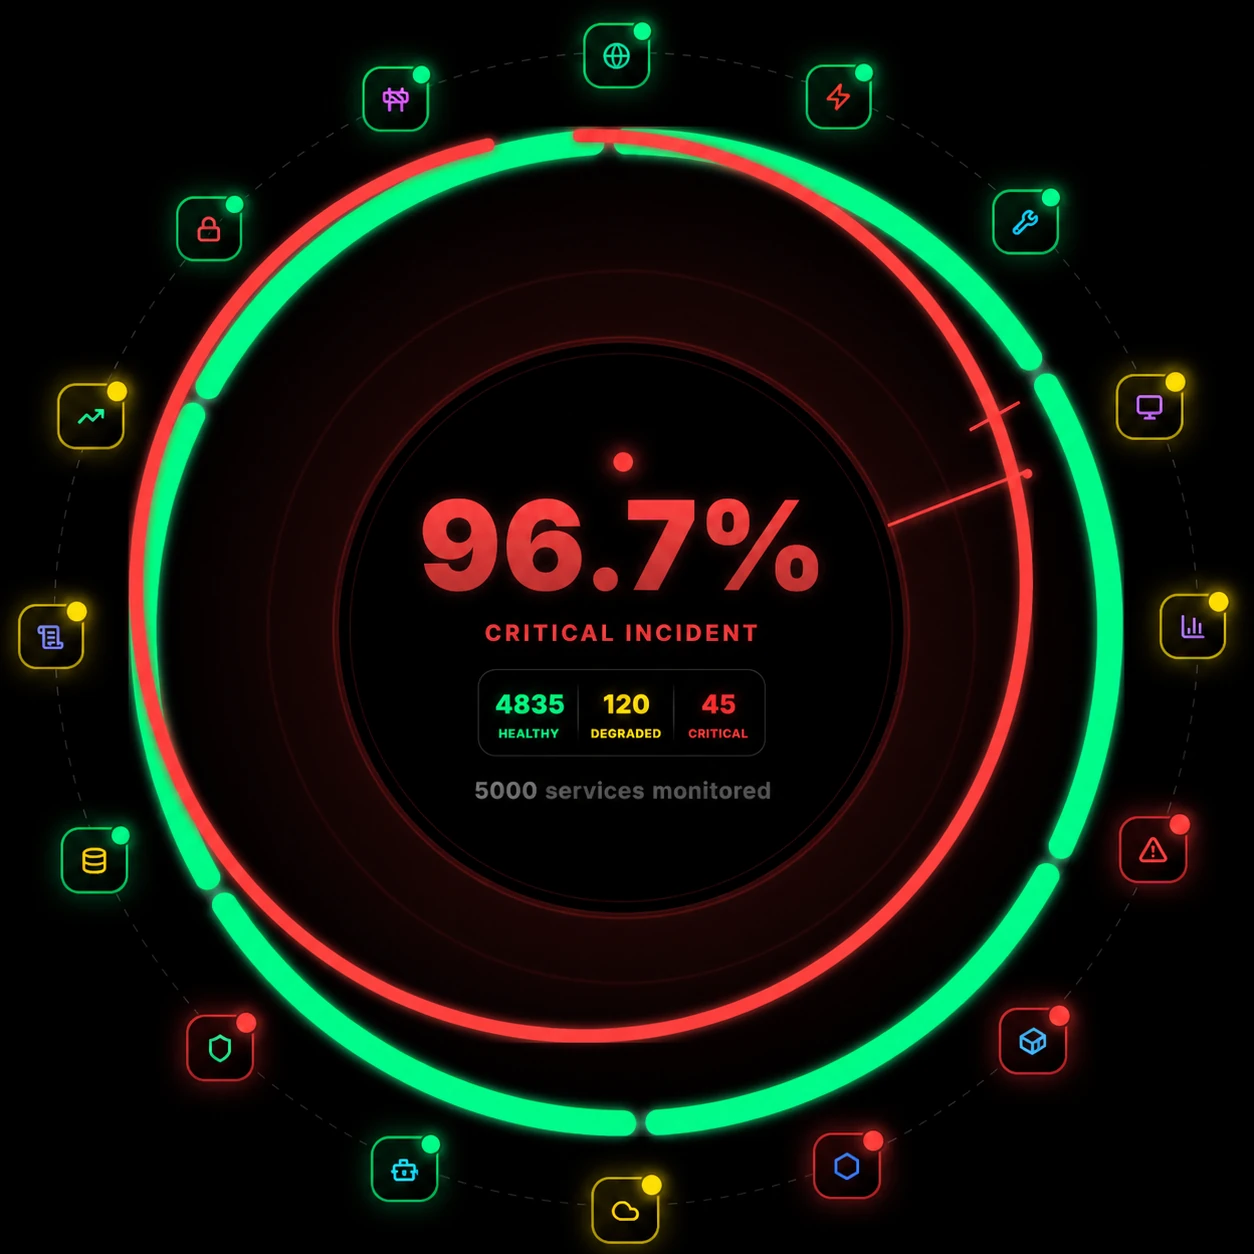
Healthy
Degraded
Critical