Health scores, MTTR trends, reliability snapshots, traffic distribution, executive dashboards. The metrics that translate engineering work into business outcomes.
Agent registration, onboarding, and fleet management with 1-line install, auto-discovery, fleet health dashboards, and version management.
ExploreVisual container dependency topology with drill-down into resource usage, anomaly highlighting, and real-time relationship mapping across your entire cluster.
ExplorePlatform-wide health overview with composite health score, system metrics, component status, and dependency health mapping across your entire infrastructure.
ExploreMean Time To Resolve tracking and analysis with per-team breakdown, improvement velocity, and benchmark comparison across your incident response organization.
ExploreOne dashboard, one glance, total clarity. Nova AI distills your entire infrastructure health into a single color-coded status so you know where you stand in.
ExploreReal-time application status command center with service health monitoring, uptime tracking, and status page integration for your entire platform.
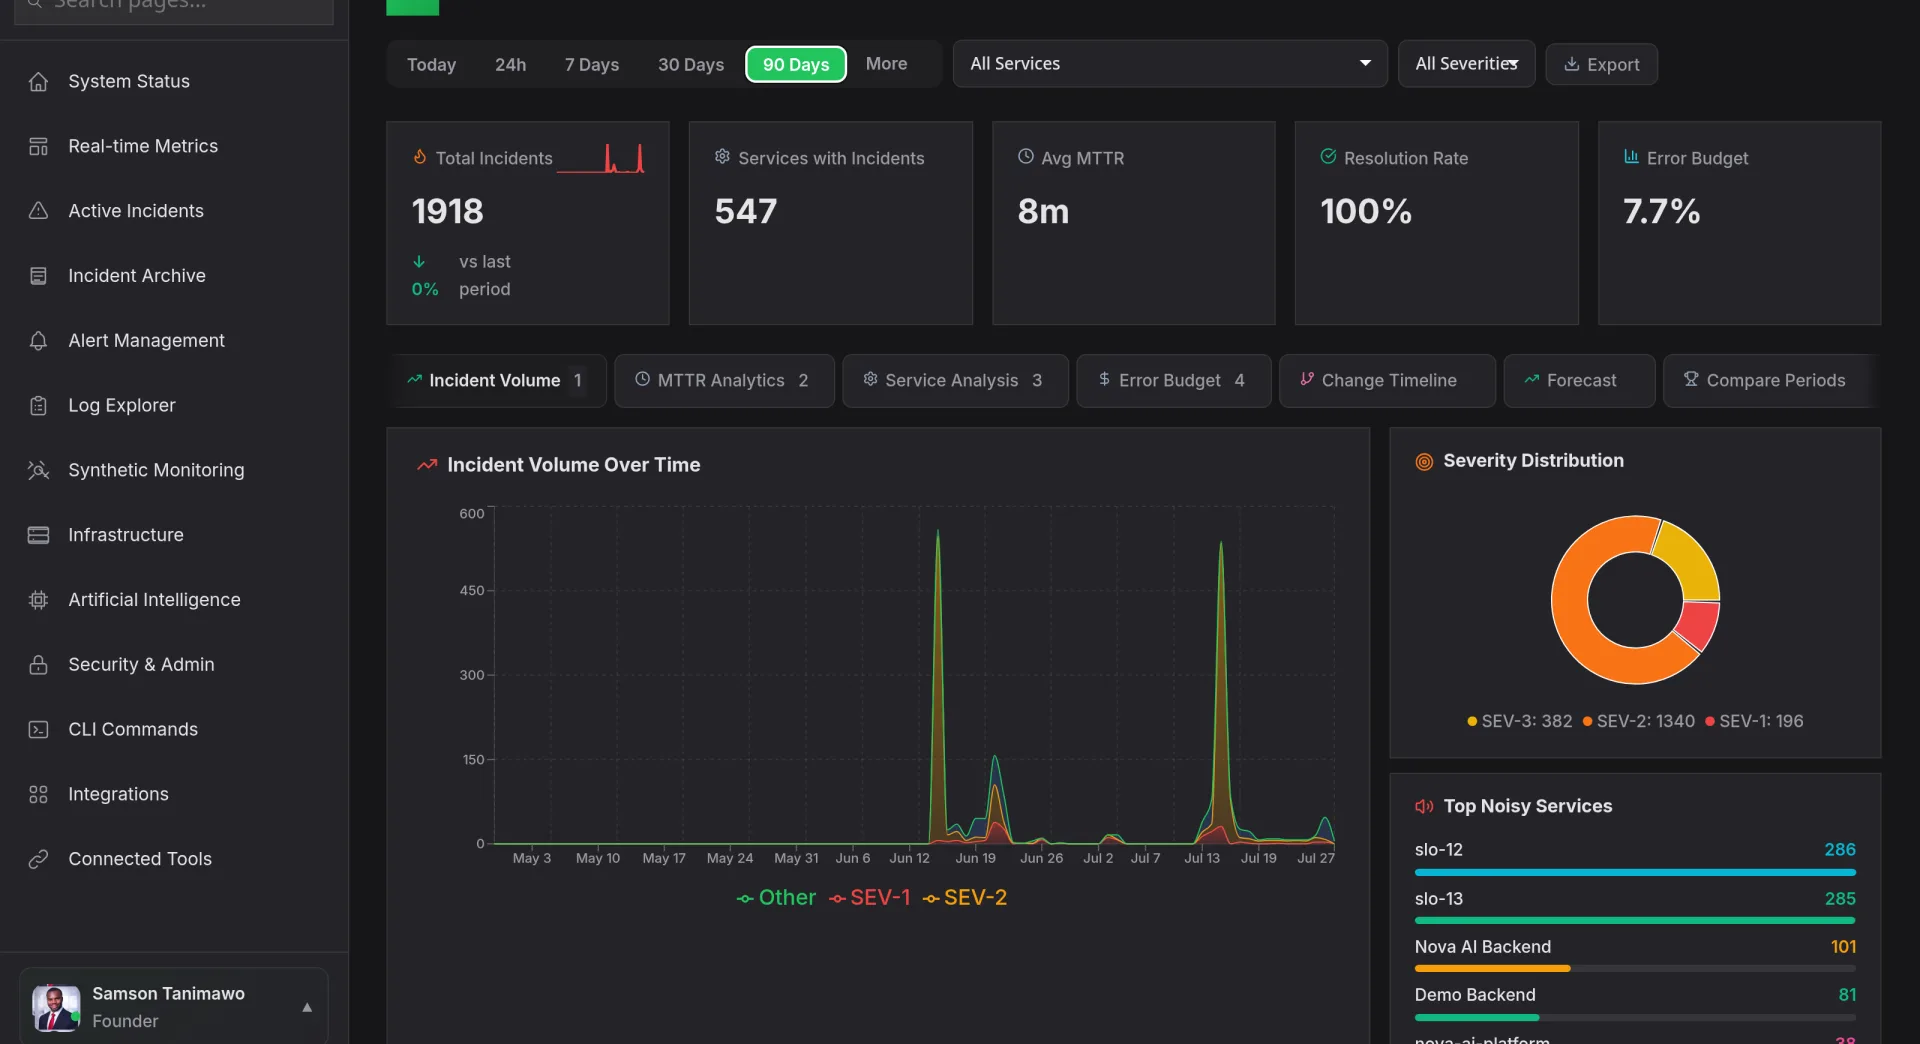
ExploreIncident load, historical footprint, SLO burn rate, and error budget tracking in a single reliability overview for your entire platform.
ExploreReal-time system resource monitoring with live CPU, memory, disk, and network gauges. Threshold alerting and historical comparison built in.
ExploreTimeline-based analytics dashboard with event visualization, activity density mapping, peak hour analysis, and cross-team visibility.
ExploreMulti-visualization traffic flow analysis with geographic distribution, protocol breakdown, and bandwidth analytics across your entire infrastructure.
ExploreIncident and metrics trend analysis with multi-chart visualization, forecasting, seasonal pattern detection, and anomaly highlighting.
Explore