app.novaaiops.com/novaql
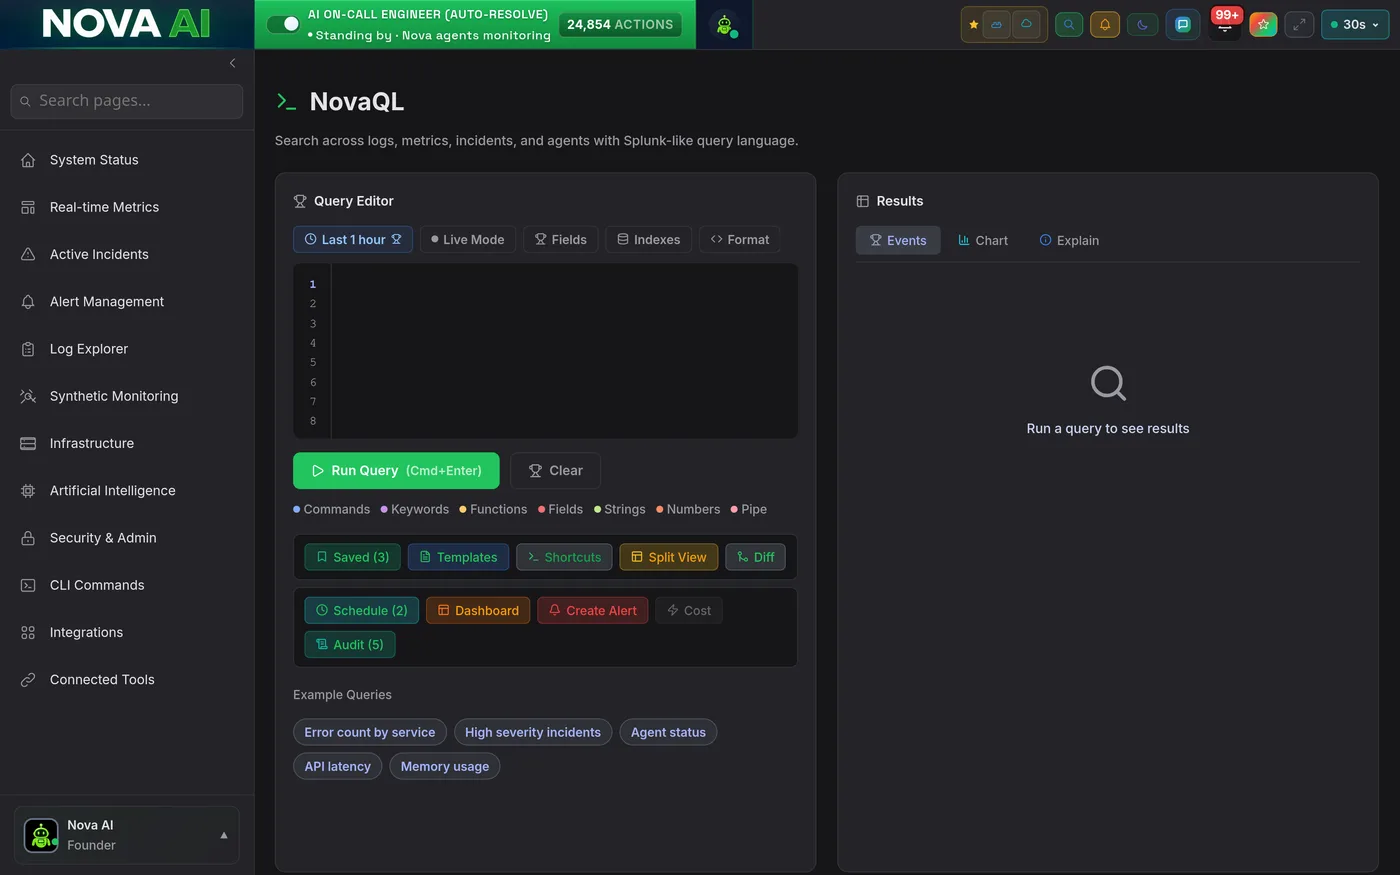
NovaQL is a unified query language for your entire observability stack. Write structured queries with familiar Splunk-like syntax, or just type a question in plain English, to search across logs, metrics, incidents, and agent activity in a single execution. Results render as raw events, auto-generated charts, or an AI explanation of what the data means.
NovaQL's multi-line editor uses a pipeline syntax that will feel immediately familiar to anyone who has written Splunk SPL or Datadog queries. Write index=prod error | stats count by service and get results across 1B+ log events in seconds. The same query language spans metrics, incidents, and agent activity, no switching tools, no copy-pasting between tabs.
| pipe operators, just like SplunkEvery NovaQL query returns results across three tabs: Events (raw log lines and structured records), Chart (auto-generated time-series, bar, or distribution chart based on what the data contains), and Explain (an AI-written plain-English summary of what the data shows, what's abnormal, and what it likely means for your system health).
Not every investigation starts from a blank query box. Nova's Example Query Library provides one-click query chips for the most common SRE scenarios, error spike analysis, latency outlier detection, agent fleet status, incident frequency trends, and more. Click a chip, the query populates, and results appear in under a second. Experienced engineers can modify them; junior engineers can run them immediately.
NovaQL's natural language mode removes the last barrier to querying your observability data. Type "show me error spikes in the payment service over the last 6 hours broken down by endpoint" and NovaQL translates it into a structured query, executes it, and explains the results, all in under 3 seconds. Accessible to every engineer on the team, not just the ones who know the query syntax.
Logs, metrics, incidents, and agents, queryable together in real-time. Start asking questions in seconds.